The market-based price for Yorvipath is worth it
TURN THE PAGE
Our Center for Pharmacoeconomics (CPE) Exclusive suggests Yorvipath’s societal benefits for hypoparathyroidism can outweigh its cost even at US market-based pricing over the exclusivity period.
Our most recent CPE Exclusive evaluates the societal impact of Yorvipath® (palopegteriparatide, developed as TransCon PTH by Ascendis Pharma) for chronic hypoparathyroidism. In August 2024, the U.S. Food and Drug Administration approved Yorvipath for adults with hypoparathyroidism.
People living with hypoparathyroidism experience symptoms of hypocalcemia (e.g., fatigue, pins and needle sensations, muscle cramps, brain fog), hypercalcemia (e.g., weakness, constipation), anxiety, and a reduced quality of life. Long-term complications, some of which can be life-threatening, can include extra-skeletal calcifications and chronic kidney disease.
Conventional therapy, which consists of active vitamin D and calcium supplementation, is inadequate because it only manages the symptoms of low calcium rather than restoring the physiological levels of the parathyroid hormone. It often does not optimally control calcium levels, does not alleviate the short-term symptoms and the reduced quality of life associated with hypoparathyroidism, and is associated with its own set of long-term consequences.
Unlike conventional therapy, Yorvipath is designed to replace the physiological levels of parathyroid hormone. Evidence for Yorvipath showed that 79% of people receiving Yorvipath were able to achieve normal serum calcium levels and independence from conventional therapy, as compared to only 5% who received conventional therapy. People receiving Yorvipath experienced significant improvements in health-related quality of life to levels in line with the general population. Related to renal function, people receiving Yorvipath experienced a mean improvement in renal function (eGFR improvement of 7.9 mL/min/1.73 m2 after 26 weeks as compared to an eGFR decline of -1.9 mL/min/1.73 m2 for patients on conventional therapy). Based on our societal impact analysis, we think Yorvipath could have a positive or neutral impact on all 24 value elements.
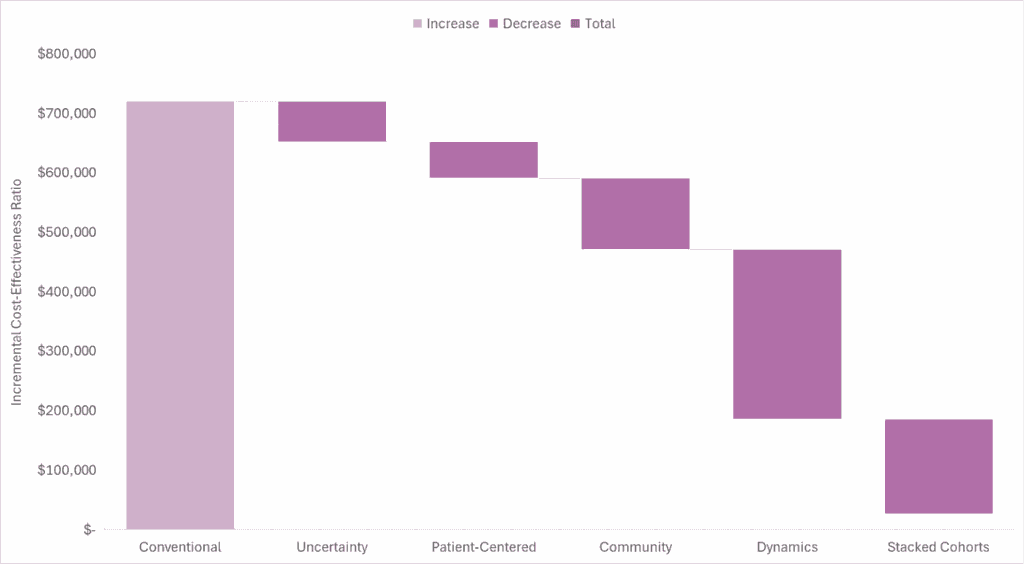
Based on our generalized cost-effectiveness analysis, we expect the market-based US price for Yorvipath to be less than its quantifiable societal benefit. Accounting for the conventional, uncertainty, patient-centered, community, and dynamic value domains, even without using stacked cohorts, suggests a cost-effectiveness estimate in line with previously used thresholds, although there is no explicit or single threshold for the US. Accounting for stacked cohorts over the product’s potential time in the market makes the estimate even more favorable.
In the waterfall diagram below, we present the incremental cost-effectiveness ratio for Yorvipath as compared to conventional therapy and the impact quantifying each domain of value has on the incremental cost-effectiveness ratio.
Read our full report-to understand the model inputs and assumptions that informed our analysis.
SAD BUT TRUE
Accounting for future drug price dynamics is commonplace in financial modeling to inform healthcare investment decisions but is rarely done in cost-effectiveness analyses. I recently read “Biotech Forecasting and Valuation” by Dr. Frank David. It’s a great read. There are multiple chapters dedicated to market dynamics. When discussing loss of exclusivity, it says, “end users of biotech models expect them to describe the timing and magnitude of decreased sales volume and price after loss of exclusivity”.
In contrast to biotech valuation models, less than 5% of cost-effectiveness analyses incorporate price changes after loss of exclusivity. I would argue that end users of cost-effectiveness analysis models do not expect cost-effectiveness analysis models to describe the price after loss of exclusivity given less than 10% of health technology assessment guidelines recommend including assumptions about future drug price changes in the base case cost-effectiveness analysis.
With my colleagues from the Center for the Evaluation of Value and Risk in Health at Tufts Medical Center, I have argued that incorporating drug price dynamics is a step forward in making cost-effectiveness analysis projections more realistic.
Incorporating price dynamics can dramatically change the cost-effectiveness findings. We illustrate this below using our analysis of Yorvipath.
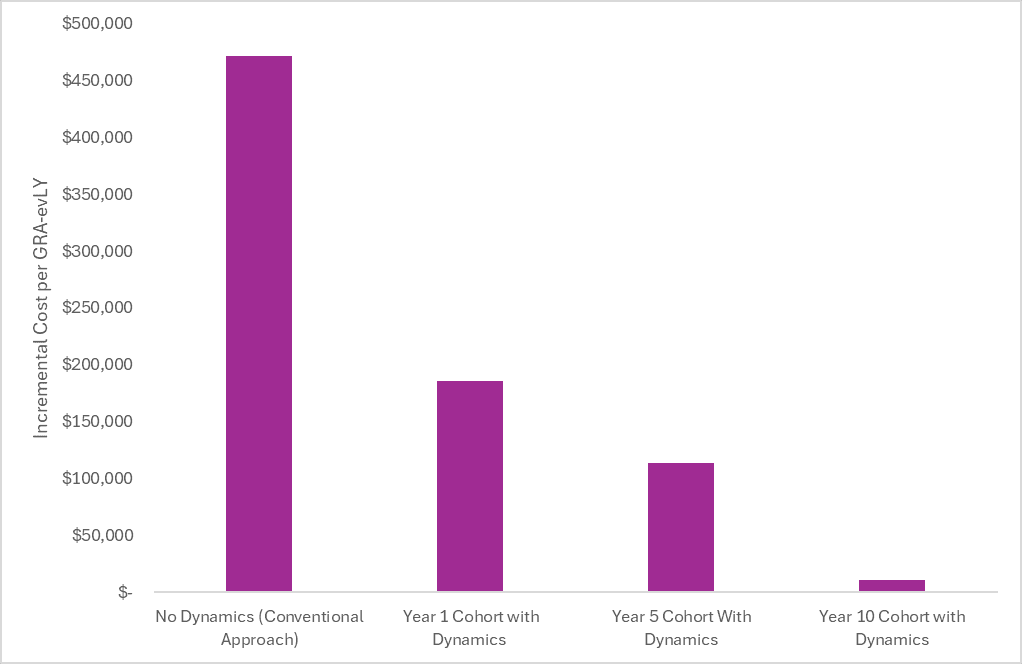
In the first bar, we plot the incremental cost-effectiveness ratio from the societal perspective without accounting for price dynamics. In this “No Dynamics” scenario, the launch price is held constant over the patient’s remaining lifetime (e.g., 30+ years for this model that started at the age of 48). Although the investors and innovators reading this find this assumption far from reality (and far from the assumptions in their financial models), this is the conventional approach in cost-effectiveness analysis.
In the second bar, we plot the incremental cost-effectiveness ratio from the societal perspective for a cohort starting Yorvipath at launch and include a price drop after the assumed loss of exclusivity (i.e., we assume a drop in price to $33,000 per year after 14 years). In this scenario, the branded price is included in the model for the first 14 years, followed by the post-loss of exclusivity price after 14 years. The incremental cost-effectiveness ratio becomes more favorable because the incremental treatment costs are substantially lower over the patient’s lifetime. Incorporating price dynamics can have a dramatic impact on the cost-effectiveness of chronically administered treatments.
The third bar plots the incremental cost-effectiveness ratio from the societal perspective for a cohort starting Yorvipath five years after launch and includes the same price drop after loss of exclusivity. In this scenario, the branded price is included in the model for the first 10 years (because the model didn’t start at launch) and included the post-loss of exclusivity price after 10 years.
The fourth bar plots the incremental cost-effectiveness ratio for a cohort starting Yorvipath 10 years after launch and includes the same price drop after loss of exclusivity. In this scenario, the branded price is included in the model for the first 5 years (because the model didn’t start at launch) and included the post-loss of exclusivity price after 5 years.
The cost-effectiveness will continue to improve over time as the proportion of the time on treatment after the loss of exclusivity increases. Incorporating drug price dynamics is a step forward in making cost-effectiveness analysis projections more realistic.
SO WHAT
In last week’s newsletter, I talked about how Aubagio® (oral teriflunomide) was launched at a price of $55,000 per year (inflated to present value) in 2012. As expected, generic competition eventually entered and now the price of generic teriflunomide is less than $100 per year from the Mark Cuban Cost Plus Drug Company. I keep harping on the fact that the pharmaceutical market design is set up so that expensive branded drugs should eventually become cheap generics over time. Why is this essential to consider in cost-effectiveness analyses?
Using a beta version of the No Patient Left Behind Generalized Cost-Effectiveness Analysis Calculator (thanks for the early access!), I can easily demonstrate why this matters. I plugged in cost and consequence inputs for teriflunomide into a beta version of their calculator.
The conventional cost-effectiveness estimate (i.e., only looking at health system costs and patient health benefits and keeping the branded price constant over the patient’s lifetime) was approximately $240,000 per health outcome gained as compared to best supportive case. This is in line with published estimates of the conventional cost-effectiveness of teriflunomide as compared to best supportive care.
Although no single threshold is used in the US for healthcare decision making, this cost-effectiveness estimate exceeds commonly used thresholds of $100,000 to $150,000 per health outcome gained. Therefore, if conducting a conventional cost-effectiveness analysis and keeping the “high” branded price constant over the time horizon of the model, one could conclude that the “high” price was not worth paying.
However, if we update the analysis to account for the fact that after 11 years, the “high” price dropped by 99% (as we have witnessed in the real-world), the cost-effectiveness estimate drops to $133,000 per health outcome gained for patients who started the drug at launch. This estimate is in line with commonly used cost-effectiveness thresholds.
Importantly, this cost-effectiveness estimate is only for patients who started the treatment at launch. The cost-effectiveness will continue to improve over time as the proportion of the time on treatment after the loss of exclusivity increases. If we assume stacked cohorts over the product’s lifecycle, the cost-effectiveness estimate further improves to $64,000 per health outcome gained.
The figure below shows how the cost-effectiveness estimate changes from assuming static pricing (i.e., conventional cost-effectiveness), to assuming dynamic pricing for a single cohort at launch, to assuming dynamic pricing with stacked cohorts.
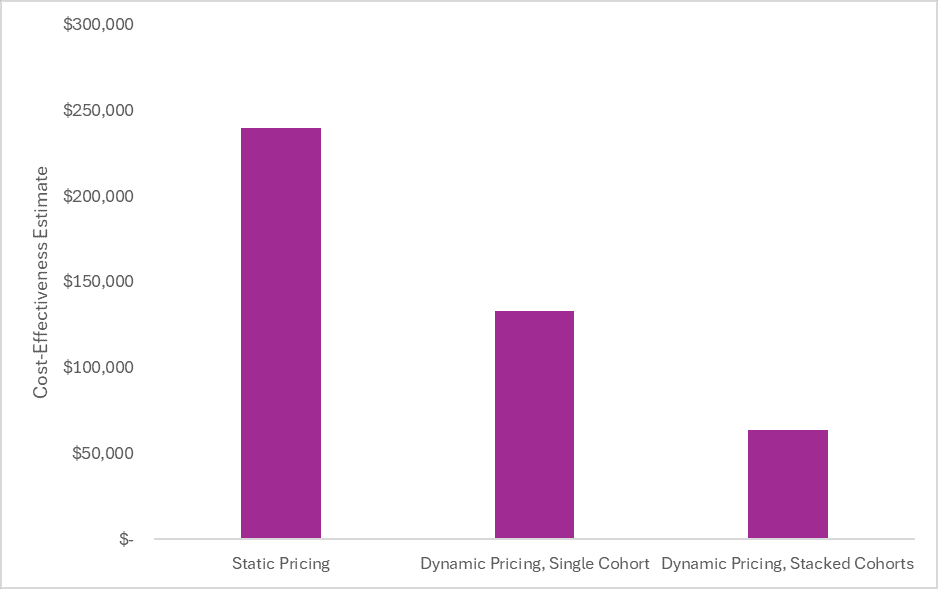
The incremental cost-effectiveness ratios in the figure above are all from the healthcare sector perspective. Expanding the perspective to a societal one, as is recommended in generalized cost-effectiveness analysis, makes the cost-effectiveness even more favorable.
The waterfall diagram below shows how accounting for the uncertainty and patient-centered domains further improves the cost-effectiveness estimate. These estimates are conservative because we didn’t account for caregiver impacts or real option value, and we assumed a default risk aversion parameter of 0.282, which is probably too low for multiple sclerosis; however, the point I am trying to make is still illustrated.
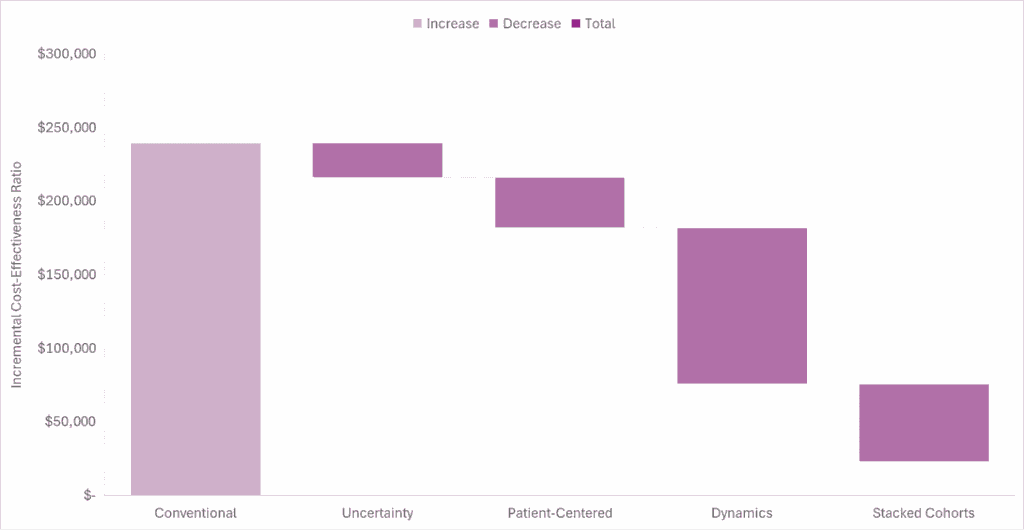
If this analysis was done at the time Aubagio was launched, conventional cost-effectiveness analysis would have suggested that the launch price was too high (if using commonly cited thresholds). However, accounting for future price drops due to genericization and accounting for societal benefits suggests the price was well worth it.
Disclosures
The Center for Pharmacoeconomics (“CPE”) is a division of MEDACorp LLC (“MEDACorp”). CPE is committed to advancing the understanding and evaluating the economic and societal benefits of healthcare treatments in the United States. Through its thought leadership, evaluations, and advisory services, CPE supports decisions intended to improve societal outcomes. MEDACorp, an affiliate of Leerink Partners LLC (“Leerink Partners”), maintains a global network of independent healthcare professionals providing industry and market insights to Leerink Partners and its clients. The information provided by the Center for Pharmacoeconomics is intended for the sole use of the recipient, is for informational purposes only, and does not constitute investment or other advice or a recommendation or offer to buy or sell any security, product, or service. The information has been obtained from sources that we believe reliable, but we do not represent that it is accurate or complete and it should not be relied upon as such. All information is subject to change without notice, and any opinions and information contained herein are as of the date of this material, and MEDACorp does not undertake any obligation to update them. This document may not be reproduced, edited, or circulated without the express written consent of MEDACorp.
© 2025 MEDACorp LLC. All Rights Reserved.