Entresto is cost saving and my two cents on the new CEA guidelines
HERO OF THE DAY
Generic Entresto® (sacubitril/valsartan) is cost saving to the health care system. The expected cost savings from hospitalizations averted are enough to offset the cost of the drug from the Mark Cuban Cost Plus Drug Company. Sacubitril/valsartan is now available for $0.85 a pill. Note that this price has already decreased from when a generic version first hit the shelves at the end of July 2025, and the price will likely continue to decrease over time.
Using our heart failure Markov model (previously summarized and reported here) that accounted for hospitalizations and death, I looked at the health system costs with and without Entresto.
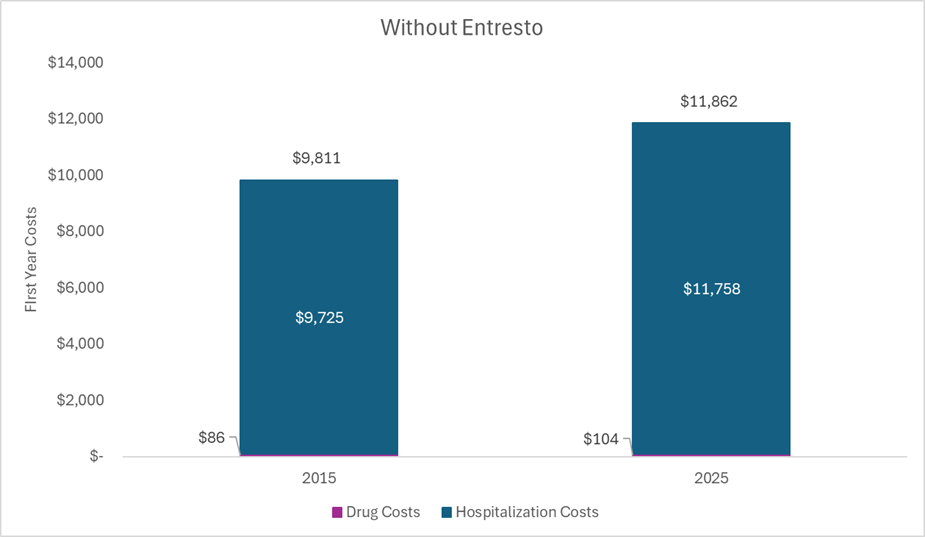
Without Entresto. The figure below plots select health system costs for an average patient with heart failure treated with a generic ACE inhibitor in the year 2015 and in the year 2025. The drug costs include a generic ACE inhibitor and the hospitalization costs align with hospitalization probabilities while on an ACE inhibitor. The same hospitalization unit costs were used for the two different years, but were adjusted to the year represented. Thus, the cost estimates in the 2015 bar are in 2015 US dollars, and the cost estimates in the 2025 bar are in 2025 US dollars.
With Entresto. Conversely, the figure below plots select health system costs for an average patient with heart failure treated with Entresto in the year 2015 and in the year 2025. The drug costs in 2015 include branded Entresto, the drug costs in 2025 include generic Entresto, and the hospitalization costs align with hospitalization probabilities while on Entresto. The same hospitalization unit costs were used for the two different years (and were the same as the unit costs used in the previous figure), but they were adjusted to the year represented. Health system costs decreased over time (even when not adjusting for inflation) because of the substantial decrease in the price of Entresto (sacubitril/valsartan) once generics entered the market.
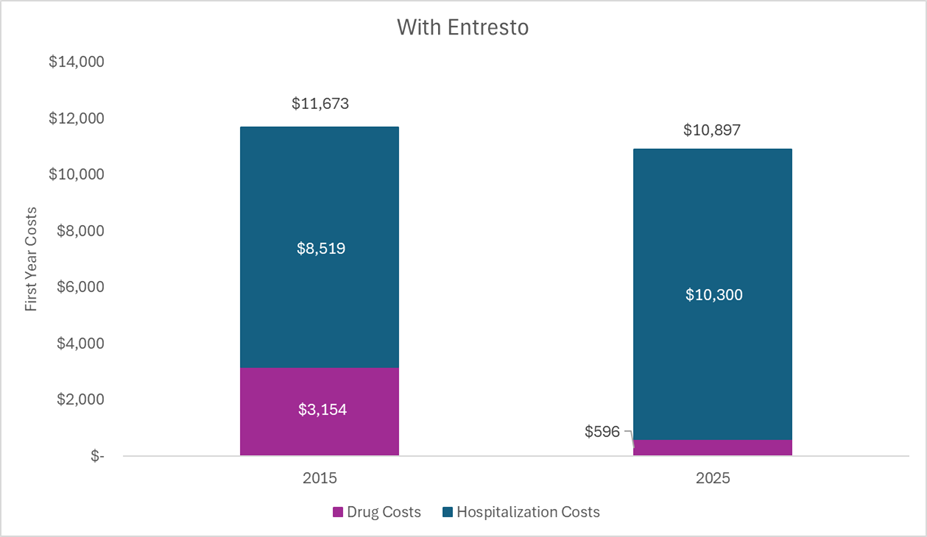
It is true that healthcare costs were higher in 2015 for those treated with Entresto as compared to a generic ACE inhibitor (nearly $2,000 more per year). During this period, Entresto was under patent protection with market exclusivity and was thus priced “high” to generate a return for the investors and incentivize future innovation. But that period of “high” pricing that can generate a budget impact was finite. For Entresto, it was around ten years. Now generic versions can be marketed forever.
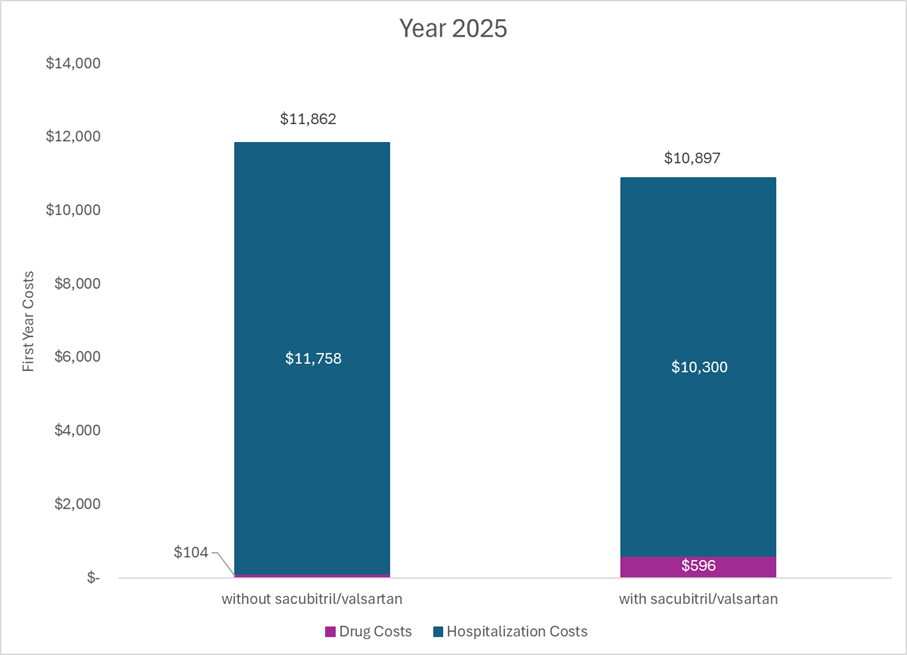
The figure below shows select health system costs in 2025 for an average patient treated with a generic ACE inhibitor and an average patient treated with generic Entresto. Costs are now lower for those treated with generic Entresto as compared to those treated with a generic ACE inhibitor. The cost savings from the hospitalizations averted are enough to offset the cost of the drug at the current price at the Mark Cuban Cost Plus Drug Company. The health system is more efficient now because Entresto was invented.
Importantly, the numbers above are from a model and all models have limitations. The cost of the drugs can vary, the costs of the hospitalizations can vary, the comparator can vary, the hospitalization probabilities can vary, and survival can vary. These aren’t perfect numbers, and they aren’t intended to be. However, they do illustrate the following:
- Drugs are special because their prices go DOWN over time. Yes, they might cause a short-term budget impact over their patent protection period, but the system is set up so that it should be short-term.
- Drugs can save health system costs over time. Like we saw with Entresto, some drugs can prevent or reduce the costs of things that do not go down in price over time (i.e., hospitalizations).
- Considering across the lifecycle of a drug and transparency like what the Mark Cuban Cost Plus Drug Company uniquely provides is integral in understanding how the market works to lower prices over time.
TURN THE PAGE
A new report defines a cost-effectiveness threshold of $120,000 per quality-adjusted life year gained for the US. The American College of Cardiology/American Heart Association (ACC/AHA) Joint Committee on Clinical Practice Guidelines just released its updated guidance on the incorporation of cost-effectiveness analyses into cardiology clinical guidelines. If you have ever wondered what pharmacoeconomists binge read, this is it.
The report acknowledged that resource allocation is a “complex process based on several considerations”. Numerous sections of the report suggested that the economic value captured in a cost-effectiveness analysis is only one component of overall value and one of many criteria that can inform decision making.
The report also emphasized health equity and the methodological potential for distributional cost-effectiveness analyses.
A single threshold of $120,000 per quality-adjusted life year was defined. The supporting literature they cite reports point estimates around $120,000 although there were intervals around each of these point estimates in the supporting literature (some ranging from $50,000 to $200,000+). A single threshold may suggest more certainty or precision than the supporting literature. When calculating net health benefit and net monetary benefit estimates, they suggest that a range of thresholds be used.
The authors acknowledged the importance of non-health system costs and consequences for cardiovascular conditions, but they recommended that the “economic value statements in ACC/AHA guidelines should be based on CEAs that adopted a health care sector perspective”. Given the Second Panel on Cost-Effectiveness in Health and Medicine recommends two reference case analyses (health care sector perspective and societal perspective), I was surprised to see the emphasis on the health care sector perspective and the recommendation to only include societal perspective analyses as supporting text.
I was looking for a stronger rationale than “the use of a societal perspective is currently uncommon in cardiovascular CEAs, largely because costs and benefits outside the health care system are often unavailable”. They note that “consideration of these effects in CEAs of cardiovascular interventions may enable a more comprehensive evaluation”. If we want more analyses from the societal perspective, and if we want more evidence around non-health system impacts, then we need guideline groups to signal that they will be considered.
Two things I did not see discussed were generalized risk-adjusted cost-effectiveness analysis (GRACE) and dynamic prices (i.e., accounting for changes in a drug’s price over time). The report talked about the consideration of severity of disease as a contextual factor (I’m assuming in a qualitative way), but the methodological potential of GRACE to account for this quantitatively was not discussed. I also could not find any guidance on how cost-effectiveness analyses that did or did not consider changes to a drug’s price over time should be assessed. There was acknowledgement of the heterogeneity in price (wholesale acquisition cost, net price, etc.), but this was not referring to variability in price over time. The only thing I saw that might relate to the consideration or lack of consideration of future genericization was “that the level of certainty should not include considerations of whether the cost effectiveness of the intervention is likely to change if the cost of the intervention itself changes over time”.
SO WHAT
The things I called out in the section above—threshold variability, societal perspective, GRACE, price dynamics—influence the cost-effectiveness.
The figure below is from our cost-effectiveness analysis of Attruby™ for transthyretin amyloid cardiomyopathy. The uncertainty bar represents an application of GRACE, the patient-centered bar and the community bar capture societal costs, and the dynamics bar represents future changes to a drug’s price and cohorts that start treatment after the launch year.
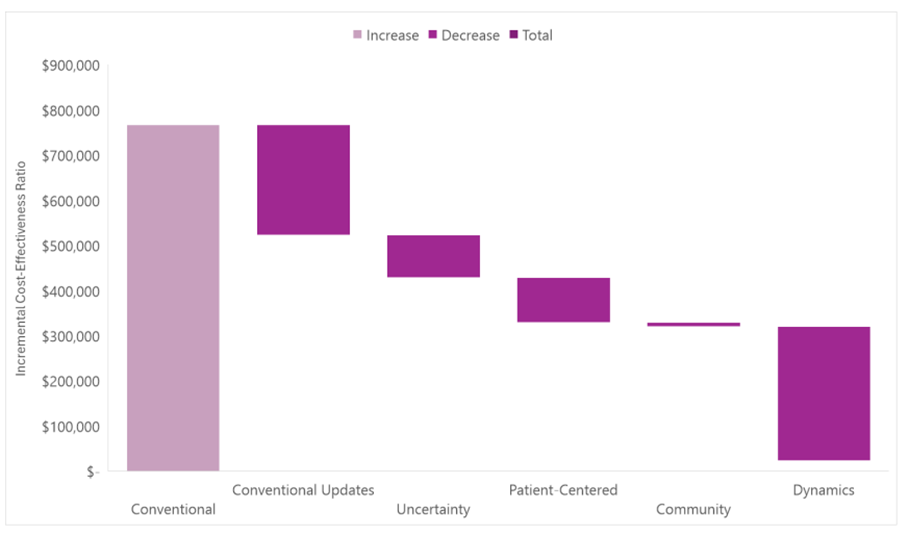
Related to the Attruby case study above, transthyretin amyloid cardiomyopathy is a rare disease (which some have suggested a higher threshold for rare conditions). Transthyretin amyloid cardiomyopathy is also a severe disease (and thus it isn’t a surprise that GRACE influences the findings). At its current price, Attruby is expensive as it is still under patent protection, but its patent will eventually expire. It’s a small molecule drug and thus generic equivalents will eventually enter the market to drive down its price (and thus it isn’t a surprise that dynamics influence the findings). We saw in the Entresto example above how inexpensive small molecule drugs can become with generic competition.
I present this not to suggest a specific cost-effectiveness estimate for Attruby, but to illustrate that these additional value domains influence the cost-effectiveness estimate and interpretation. I also do not present this as what “should” be used to inform decisions. Rather, I am suggesting there are decisions made in a cost-effectiveness analysis that should be considered, varied, and reported transparently. As pharmacoeconomic models increase in relevance, so should their methodological rigor and transparency.
Disclosures
The Center for Pharmacoeconomics (“CPE”) is a division of MEDACorp LLC (“MEDACorp”). CPE is committed to advancing the understanding and evaluating the economic and societal benefits of healthcare treatments in the United States. Through its thought leadership, evaluations, and advisory services, CPE supports decisions intended to improve societal outcomes. MEDACorp, an affiliate of Leerink Partners LLC (“Leerink Partners”), maintains a global network of independent healthcare professionals providing industry and market insights to Leerink Partners and its clients. The information provided by the Center for Pharmacoeconomics is intended for the sole use of the recipient, is for informational purposes only, and does not constitute investment or other advice or a recommendation or offer to buy or sell any security, product, or service. The information has been obtained from sources that we believe reliable, but we do not represent that it is accurate or complete and it should not be relied upon as such. All information is subject to change without notice, and any opinions and information contained herein are as of the date of this material, and MEDACorp does not undertake any obligation to update them. This document may not be reproduced, edited, or circulated without the express written consent of MEDACorp.
© 2026 MEDACorp LLC. All Rights Reserved.