Comparing drug prices across countries doesn’t make sense
SAD BUT TRUE
Comparing drug prices in the US to drug prices in other countries is way more nuanced than it might seem. This past summer, a paper published in JAMA Health Forum examined how drug prices change after patent expirations in select high-income countries. Figure 1 from the paper was all over social media and it showed how a drug’s price drops much steeper after patent loss in the US as compared to other high-income countries.
It is a valuable paper to show the importance of considering prices across a product’s lifecycle rather than only during its patent period. It empirically showed something we talk about here all of the time—a branded drug’s price is only high for a finite period of time. We need to think long-term when judging a drug’s price.
Many people looked at Figure 1 from the paper and tried to make direct comparisons between drug prices in high-income countries—which is something people seem to be fixated on. However, the paper reported relative changes over time for each country separately, anchored on each country’s price right before patent expiration. Therefore, one cannot simply look at Figure 1 from the paper to know how the actual price compares across the countries (because each country is anchored on something different), but one could synthesize across some different pieces of data to try to do so. I do that here (for illustrative purposes only, not because I think prices should be directly compared between countries) by combining the select data they report on how prices for drugs compare between the countries during the patent period and the relative changes in price pre- and post-patent expiration.
The paper reported, “Mean list prices in the US were between 3.5 (Japan) and 1.6 (Germany) times higher for new originator drugs under patent protection”. There were other countries included in the analysis (e.g., UK, Canada, and others), so those multipliers must be somewhere between 1.6 and 3.5. (Note: Yes, these are list prices. All caveats around list prices hold.)
(Side bar: It isn’t “new news” that the US pays more than other countries over the patent period. The returns to the innovator during this period are what drives future innovation. Because of the high prices we pay, the US has “been critical to improving health worldwide by leading the way in the research and development (R&D) that enables drug discovery”. This “foreign ‘free-riding’ on U.S. investments and innovation” will be discussed extensively through our work, and is essential to understand the extent, but it is not the focus of this specific section. The focus of this specific section is to highlight the importance of thinking across a product’s lifecycle and challenges comparing prices across countries).
Using data only during the patent period, one might conclude that the US pays 3.5x that of Japan and 1.6x that of Germany. If we also want to look at Canada and the UK, we might assume that the US pays 3x that of Canada and the UK (Note: I couldn’t find this estimate reported in the paper. I am just assuming a number between 1.6 and 3.5 because I know those are the bounds).
However, it’s more nuanced than only looking across the patent period. Let’s bring in the data on drug price changes before and after patent expiration to see how the differential as compared to the US changes. We saw from the paper published in JAMA Health Forum that the US is really good at getting prices to fall off a cliff after the patent period. The time for us to pay back the innovator for their innovation has expired, competition can enter, and the payment strategy can change.
Looking at 8 years of price changes before patent expiration and 8 years of price changes after patent expiration (based on what was reported in the study), and assuming the US price right before patent expiration is 3.5x higher than Japan, 1.6x higher than Germany, and 3x higher than the UK and Canada (see my reasoning for this assumption above), the differential narrows. Accounting for the different relative changes in price before and after patent expiration, one might now conclude that the US pays 2.7x that of Japan, 1.29x that of Germany, 2.25x that of the UK, and 2.37x that of Canada. (Note: This is only using data for 8 years after patent expiration. The differentials would likely continue to narrow as the time after patent expiration exceeded the time under patent protection).
Now let’s adjust based on GDP per capita based on purchasing power parity (PPP). If we adjust the differences in drug prices across the product’s lifecycle (using only 8 years of data pre and post patent expiration) by the relative difference in PPP GDP, the US drug price differential gets even smaller. The differential in the US is now 1.66x that of Japan, 1.10x that of Germany, 1.62x that of the UK, and 1.78x that of Canada.
The figure below plots these differentials under these different assumptions.
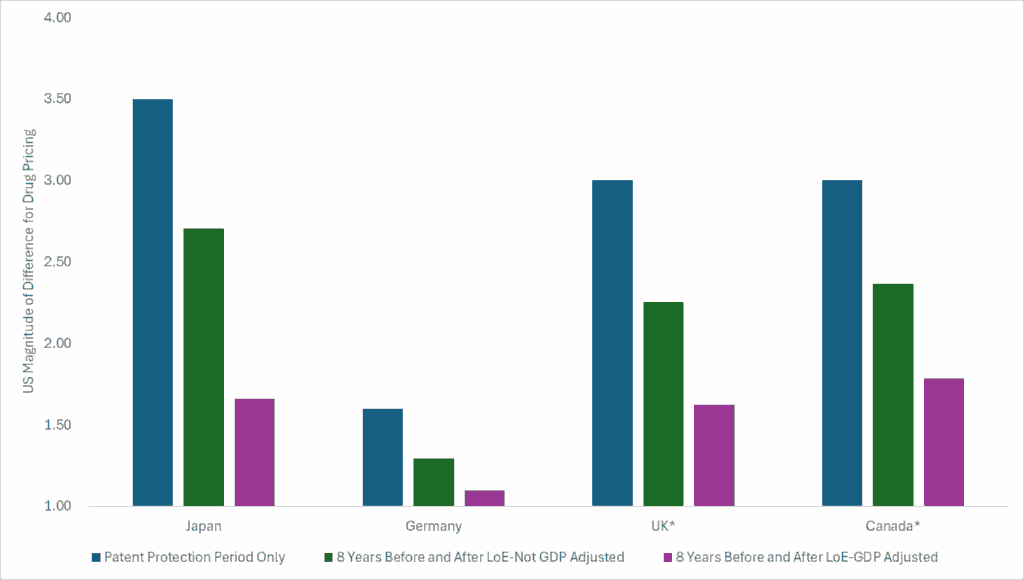
From this exercise, I can see that: 1) the US pays more over the patent protection period which is the period that incentivizes innovation and keeps the innovation train going, 2) the US is good at getting prices to fall off a cliff after the patent period, 3) drug prices change over time and thinking long-term is important, and 4) comparing prices across countries is way more nuanced than people make it seem.
Importantly, the intent of this exercise is not to suggest a specific differential between US drug prices and drug prices from other high-income countries and we understand that we use imperfect data here. Rather, the intent of this exercise is to show that comparing US drug prices to drug prices in other countries doesn’t make sense and is certainly less straightforward than it might seem. Plausible assumptions that we illustrate here (such as considering the product’s lifecycle and adjusting prices based on relative differences in PPP GDP), and others that we didn’t discuss here, result in different estimates that change the differential.
TURN THE PAGE
Our CPE Exclusive on Dupixent for COPD was covered by Fierce Pharma last week. It was obviously exciting to see our work highlighted in the press, but the specific content that was selected to be highlighted (as well as the content that was not selected to be highlighted) excited me far more.
Historically, much of the press covering findings from economic models have focused on whether or not a drug is “cost-effective” and what a drug’s “value-based” price is. There are nuances to both of these. One, whether or not something is “cost-effective” isn’t as straight-forward as it might seem. In many cases, alternative assumptions can be made that could dramatically influence the cost-effectiveness finding. The same is true for a single “value-based” price.
Additionally, when the conversation is centered around a drug’s price, it is easy to forget the impact these treatments have. Healthcare innovations can do extraordinary things for patients, caregivers, the health system, and society. Economic models can be powerful tools to extrapolate and synthesize evidence to explain these potential impacts.
In the Fierce Pharma article, there was no mention of the drug’s price, no mention of whether it is cost-effective or not, and no presentation of a “value-based” price. Rather, to my delight, the Fierce Pharma article shined a light on 1) the potential societal impacts of Dupixent for COPD, 2) that its price is expected to change over time, and 3) its cost-effectiveness varies based on what you include in the analysis. These three things are integral to our work at CPE.
Specific content from the article:
Topic Area #1-Potential societal impacts of a treatment. “As for caregivers, it is estimated that Dupixent use will allow patients to need 40 fewer hours of care—even though their lives are extended.”
Topic Area #2-A drug’s price changes over time. “One way that conventional cost-effectiveness analyses come up short—according to the CPE—is that they often assume drug pricing stays constant over time. This ignores the reality of generic and biosimilar competition, which most important drugs eventually face.”
Topic Area #3-Cost-effectvieness varies based on what you include. “As CPE notes in its Dupixent report, incorporating potential biosimilar competition—as well as patient productivity, caregiver time and other financial factors—dramatically improves the case for the COPD therapy.”
With each CPE Exclusive we release, our intent is not to suggest what the price of a drug “should” be. Rather we want to use economic models to extrapolate and synthesize evidence to estimate and communicate the long-term societal impact an innovation might have.
We also want to start a conversation around the following question: What do you really have to believe to find that the US market-based price for a specific drug is actually a great deal? From the CPE Exclusives we have released so far, you don’t have to believe much to come to that conclusion. In many cases, you just have to believe that the drug’s price will eventually drop. And the good news for us is the system is set up so that happens.
WE DID IT AGAIN
Last week’s newsletter focused on the impact of cardiovascular pharmaceuticals (e.g., statins, antihypertensives, blood thinners) on health system costs, health outcomes, and patient productivity.
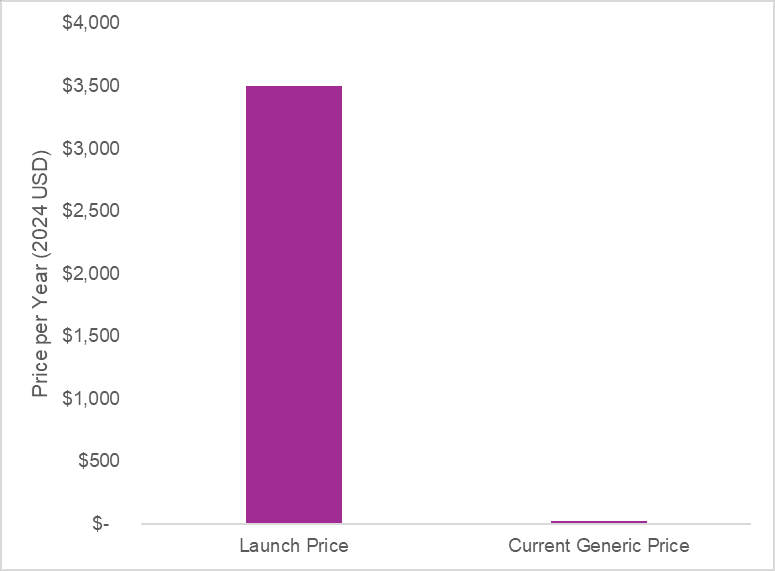
These innovations eventually faced competition (branded competition and eventual generic competition after the patent period) which resulted in substantial drops in price. As an example, atorvastatin was launched in 1996 at a price per pill of more than $5. Inflated to present value that is around $9.60 per pill. Today you can get atorvastatin for $0.07 a pill from the Mark Cuban Cost Plus Drug Company. The graph below reports the price per year at launch (inflated to present value) and the price per year now. Drug pricing is not constant over a product’s lifecycle.
A 2021 study by Lin and colleagues found “generic competition of statins was associated with significant cost savings across all major payers within the US healthcare system”. The end of market exclusivity for statins was associated with an annual savings of $11.9 billion for the US alone.
Society paid off the investment in these novel medicines and now can access the innovation for pennies—with the health and non-health benefits persisting. Competition, especially generic competition after the protected period, reduces health system costs. Diseases cost society tons of money and developing better treatments to manage diseases—treatments that eventually will face competition to drive down their prices—can reduce healthcare spending.
However, policies such as the Inflation Reduction Act (IRA) could disincentivize generic entry. A Schaeffer Center White Paper explains how the reduction in branded prices of drugs selected for Medicare Drug Price Negotiation may reduce the incentives for generic competition to enter.
In a previous project I worked on with Dr. Joey Mattingly, we engaged manufacturers of small molecule generic products and we heard that the price of the branded product was an important factor for the first filer of the generic small molecule drug. This is because, based on the 180-day exclusivity period incentive within Hatch-Waxman, the first filer expects a brief period of duopoly with the branded agent and thus expects to receive a time-limited but high-profit period.
The first-filer generic would enter the market at a lower price than the branded product to gain market share, but the first filer price during the 180-day exclusivity period is typically higher than the long-term stable price of a generic because a duopoly exists for a limited period of time. This high-profit period incentivizes generic manufacturers to enter the market and to enter the market quickly.
But if a branded small molecule drug experiences a large reduction in price due to Medicare Drug Price Negotiation, that could then reduce 1) the profit the first-filer generic might receive during the 180-day exclusivity period because it would need to enter at an even lower price and 2) the market share the generic small molecule manufacturer might get if the branded product also experienced a reduction in price. Reduced profit and reduced market share are disincentives for generic entry.
Disclosures
The Center for Pharmacoeconomics (“CPE”) is a division of MEDACorp LLC (“MEDACorp”). CPE is committed to advancing the understanding and evaluating the economic and societal benefits of healthcare treatments in the United States. Through its thought leadership, evaluations, and advisory services, CPE supports decisions intended to improve societal outcomes. MEDACorp, an affiliate of Leerink Partners LLC (“Leerink Partners”), maintains a global network of independent healthcare professionals providing industry and market insights to Leerink Partners and its clients. The information provided by the Center for Pharmacoeconomics is intended for the sole use of the recipient, is for informational purposes only, and does not constitute investment or other advice or a recommendation or offer to buy or sell any security, product, or service. The information has been obtained from sources that we believe reliable, but we do not represent that it is accurate or complete and it should not be relied upon as such. All information is subject to change without notice, and any opinions and information contained herein are as of the date of this material, and MEDACorp does not undertake any obligation to update them. This document may not be reproduced, edited, or circulated without the express written consent of MEDACorp.
© 2026 MEDACorp LLC. All Rights Reserved.