Calls for generalized cost-effectiveness to become the norm
WE DID IT AGAIN
Before all our attention is on the next set of drugs selected for Medicare Drug Price Negotiation, we are going to highlight real-world examples of how competition substantially drove down drug pricing.
Because of the pharmaceutical market design, expensive branded drugs will likely become cheap generics that can benefit society long after their patent protection period. Let’s look at Gleevec (imatinib), a small molecule drug used to treat different types of cancer. Gleevec was approved for chronic myeloid leukemia in 2001. Here are some descriptions of imatinib: “miracle drug status,” “one of the most effective cancer treatments ever developed,” “phenomenal success rate,” “silver bullet.” That’s because people with chronic myeloid leukemia “have had their lives extended considerably” with imatinib, and for many, it has allowed them “to reach their natural lifespan.”
Gleevec was initially launched at a price of around $26,000 per year in 2001. The price continued to increase over the exclusivity period to more than $100,000 per year. That sounds like a lot of money.
However, it was only a lot of money for a short period of time. As designed, generics entered the market in 2016, around 15 years after the branded version was first approved. And today, the annual price for generic imatinib is around $420 (a 99% discount from the launch price) at the Mark Cuban Cost Plus Drug Company. A “miracle drug” with a “phenomenal success rate” is less than $2 per day. That’s not a lot of money.
This is how the system is designed to work. A drug’s price should only be high for a period of time, and then the incentives must be in place for competition to substantially reduce the price.
It is worth pointing out that after generic competition first entered the market for imatinib, there could have been opportunities for even more cost savings than what was initially realized. Two years after generics entered the market, spending was still relatively high. 46brooklyn reported that generic imatinib was “83 times more expensive than your average oral [generic] chemotherapy medication” in 2017.
An analysis led by Drs. Cole and Dusetzina reported that in the first 20 months of generic competition for imatinib, only three generic manufacturers entered the market. This is less than half of what is typically observed for other oral drugs within the first twenty months of generic competition. Additionally, the generic market share for imatinib was lower than what is typically observed for other drugs.
Cole and Dusetzina provide potential reasons for this. One, imatinib is a specialty drug with a smaller market size, which could discourage generic entrants and thus slow price competition. Also, there was a high number of “dispense as written” prescriptions for the branded product which could be due to distrust of the generic version, branded manufacturer copay assistance, or branded manufacturer advertising practices. Others have discussed the potential impact of “spread pricing” contracts and a complex supply chain.
Policies and reforms that promote generic competition and uptake after the appropriate protected period and reduce perverse incentives can reduce healthcare spending without disincentivizing innovation.
Now that we are in 2025 and can buy the “miracle drug” for less than $2 a day from the Mark Cuban Cost Plus Drug Company, we can see that things worked out quite well. As designed, the price was “high” during the patent period and then fell off a cliff after patent expiry.
SAD BUT TRUE
The Medicare Drug Price Negotiation Program looks at small molecules and biologics differently. Selected small molecules have 9 years and selected biologics have 13 years before the “negotiated” price sets in.
In a pre-IRA world, investors and innovators expected around a 14-year period to be paid back for their innovation based on patent exclusivity periods. In a world with the IRA, there is another time period that comes in.
For biologics, there is this other 13-year time clock, but 13 years and 14 years don’t seem all that different. However, for small molecules, the other time clock is 9 years. Nine years is very different from 14 years; and 9 years (small molecule time clock for IRA) and 13 years (biologic time clock for IRA) are very different from one another.
Understandably, many people in the industry are focused on what signal this sends to investors and innovators.
There are now exploratory analyses and anecdotes from people in the field that suggest the IRA may shift some investments away from small molecules due to this shorter time clock.
As a health services researcher, I am concerned with what this could mean for long-term healthcare spending.
When a drug first launches, the price is high (for a short period of time) because we are paying back the investment. After the appropriate protected period/payback period, the price needs to drop to something closer to its cost of goods sold with a small profit margin to ensure supply, quality, etc. over the long term.
We see this in the example above with imatinib. The price was high over the exclusivity period, then the price dropped to near zero ($420 per year) after.
Imatinib is a small molecule. The price dropped to near zero after the exclusivity period because small molecules are easy/cheap to genericize and are easy/cheap to manufacture. (Caveat: Not all small molecules will drop to $420 per year. Some will drop even lower; some will be higher. Check out our paper for estimates of the cost of goods sold for different small molecule drug forms.)
Let’s contrast this with a biologic. As mentioned last week, adalimumab biosimilars have been introduced that have resulted in large reductions in spending on adalimumab. That’s great news. However, the annual cost for one of the cheapest biosimilars is still around $7,600.
The price hasn’t dropped to near zero after the exclusivity period. Biosimilars exist and have been effective at reducing pricing, but they are still relatively expensive to develop and manufacture. The cost of goods sold and the cost to develop are simply higher for biosimilars. (Caveat: Biosimilars are still relatively new so there is a chance additional price reductions might occur before we reach the long-term stable price for a biosimilar).
I am not arguing against biologics or biosimilars by any means, rather I am shining a light on the discrepancy in time to Medicare Drug Price Negotiation between biologics and small molecules and the discrepancy in time between the patent period for small molecules and the time to Medicare Drug Price Negotiation for small molecules.
We know that small molecules have the potential to become very low-cost after the innovation has been paid back, so signals away from their development could have negative impacts on the long-term spending on drugs.
As Representative Auchincloss (D-Mass) recently stated, “there is nothing more equitable in healthcare than a small molecule drug that goes generic.”
SEEK AND DESTROY
To illustrate the long-term impact of small molecules on health system costs, I want to revisit our analysis of Cobenfy™ that was released in November 2024. Cobenfy is a small molecule approved for the treatment of schizophrenia in adults. The evidence for Cobenfy suggests that it isn’t associated with weight gain as is typical of second-generation antipsychotics. Therefore, Cobenfy could reduce non-intervention health system costs due to less weight gain and fewer long-term consequences (e.g., diabetes, cardiovascular disease) associated with it.
In the graph below, we report the estimated average annual health system costs per person treated in a world without Cobenfy, during Cobenfy’s exclusivity period, and after Cobenfy’s exclusivity period.
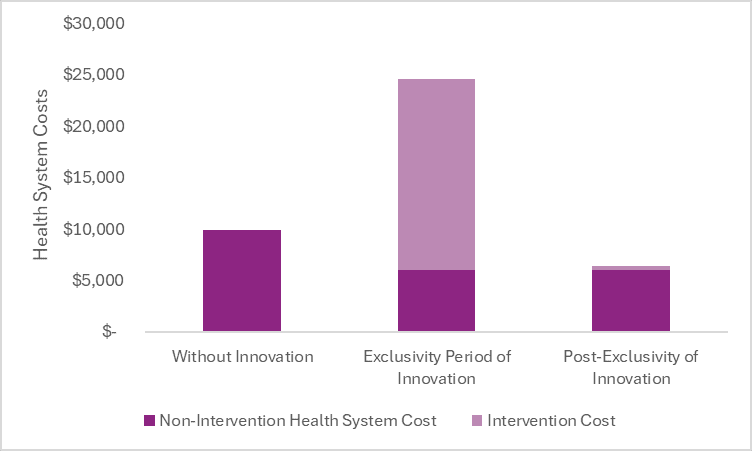
After the exclusivity period, once generic competition has entered the market and reduced the price close to its cost of goods sold, the cost of the drug is expected to be less than the cost offsets it creates in the health system. Therefore, it could save health system costs after the exclusivity period—in addition to increasing survival, improving patient quality of life, etc.
The non-intervention health system costs are lower in a world with Cobenfy due to the cost offsets it provides by way of less weight gain and less long-term consequences associated with it.
In the world with Cobenfy, the non-intervention health system costs are the same during the exclusivity period and post-exclusivity period, but the intervention costs are dramatically different. During the exclusivity period, we are paying back the innovation and rewarding the innovation based on what it does rather than what it costs. After the exclusivity period, we are no longer paying back the innovation, and thus our payment can shift to a cost-plus structure. Therefore, the intervention cost can drop dramatically.
The estimated total health system costs in the post-exclusivity period are less than the estimated total health system costs in a world without Cobenfy (and we cannot forget that we are also getting more health—survival, quality of life, etc.—in a world with Cobenfy).
Innovation can reduce health system costs, but this often requires long-term thinking.
NOTHING ELSE MATTERS
In a recent interview on The BioCentury Show, Representative Jake Auchincloss (D-Mass) talks about the gross-to-net bubble, IRA reform, and paying for value. Talk about the health policy trifecta!
I go to Brian Reid and Adam Fein for all commentary on the gross-to-net bubble, and we have already discussed the IRA quite a bit this newsletter, but I can’t pass up an opportunity to talk about paying for value.
In the interview, Rep. Auchincloss says he would “like to see Generalized Cost Effectiveness Analysis become the norm for how we assess value.”
In the interview, Rep. Auchincloss expressed “strong support for a framework for assessing value, Generalized Cost-Effectiveness Analysis.” He acknowledged the “spectrum of value that novel biomedical or medical device interventions can create” and the importance of accounting for patent expirations and subsequent generic and biosimilar competition.
The whole interview is worth a listen. Hearing a member of the US Congress explain the intricacies of health economic evaluation is what health economists dream about.
Acknowledgement of an innovation’s benefits beyond the healthcare system and recognition that an innovation’s price should only be high for a short period of time is a huge step forward.
Generalized Cost Effectiveness Analysis can quantitatively consider these things, making it a powerful framework to inform conversations and differentiate treatments.
As with Cost Effectiveness Analysis, even Generalized Cost-Effectiveness Analysis cannot comprehensively assess an innovation’s value and the preferences of society and thus it should not be used by itself to make a decision or by itself to set a price. Nevertheless, it can be an informative tool to assess some of the things an innovation can do for patients, caregivers, the health system, and society.
For a quick primer on Generalized Cost-Effectiveness Analysis and how it differs from more conventional Cost Effectiveness Analysis from the health system perspective, check out our two methods primers, hyperlinked here.
Disclosures
The Center for Pharmacoeconomics (“CPE”) is a division of MEDACorp LLC (“MEDACorp”). CPE is committed to advancing the understanding and evaluating the economic and societal benefits of healthcare treatments in the United States. Through its thought leadership, evaluations, and advisory services, CPE supports decisions intended to improve societal outcomes. MEDACorp, an affiliate of Leerink Partners LLC (“Leerink Partners”), maintains a global network of independent healthcare professionals providing industry and market insights to Leerink Partners and its clients. The information provided by the Center for Pharmacoeconomics is intended for the sole use of the recipient, is for informational purposes only, and does not constitute investment or other advice or a recommendation or offer to buy or sell any security, product, or service. The information has been obtained from sources that we believe reliable, but we do not represent that it is accurate or complete and it should not be relied upon as such. All information is subject to change without notice, and any opinions and information contained herein are as of the date of this material, and MEDACorp does not undertake any obligation to update them. This document may not be reproduced, edited, or circulated without the express written consent of MEDACorp.
© 2025 MEDACorp LLC. All Rights Reserved.