A product lifetime model is the only adequate approach
CRASH COURSE
In every newsletter to date, I have argued that cost-effectiveness analyses should include the expected changes in a drug’s price over time. If you are a new reader, here is a quick summary of our reasoning. The conventional practice in cost-effectiveness analysis is to keep a drug’s price static or constant over the entire model. If a cost-effectiveness analysis is conducted for a drug at launch, as they often are, then the prices at the time of launch would be used throughout the entire model, which is often a patient’s lifetime and spans many years. I argue that incorporating expected price changes within cost-effectiveness analyses makes these projections more realistic given we know that prices will change over time.
In this newsletter, instead of arguing for the inclusion of price dynamics within cost-effectiveness analysis, I am going to argue for the method that should be used to adequately do so.
Two approaches for including drug price dynamics have been suggested: 1) a product launch model with a single cohort and 2) a product lifetime model with stacked cohorts. I argue that a product lifetime model with stacked cohorts is the only adequate approach. I hope to convince you below.
A product launch model with a single cohort is similar to how conventional cost-effectiveness analysis is conducted but with drug price inputs that vary over time. A single cohort is used in which members of the modeled cohort start the model once a drug is launched and are tracked over the model time horizon, which is often the remaining lifetime of the modeled cohort. This is different from conventional cost-effectiveness analysis because the drug price inputs vary over time. The model can account for the duration of exclusivity, price changes over the period of exclusivity, and price changes after the period of exclusivity.
However, the product launch approach is problematic because it is only applicable for individuals who start the drug at launch. This approach would require frequent updating as the time to the loss of exclusivity changes, and unfortunately cost-effectiveness analyses are typically one-off evaluations and updates have been very limited historically.
A product lifetime model addresses this limitation and removes the requirement for frequent updating. A product lifetime model is similar to the product launch model but instead of only using a single cohort at launch, it incorporates multiple cohorts over time. A new cohort is introduced for each year that the intervention is expected to be on the market. Each cohort incorporates dynamics (i.e., duration of exclusivity, price changes over the period of exclusivity, and price changes after the period of exclusivity).
Because cohorts across the product’s lifetime are considered, rather than only modeling a cohort starting treatment at launch, cost-effectiveness estimates generated from a product lifetime model can better inform the cost-effectiveness of a treatment, rather than the cost-effectiveness of a treatment for a patient starting the drug at launch. The product lifetime model will move us closer to dynamic efficiency over static efficiency.
In a future newsletter, we will spend more time talking about the need to also incorporate dynamic prevalence in cost-effectiveness analyses. Briefly, dynamic prevalence captures how the prevalence of a condition changes over time. The good news is that you can also account for dynamic prevalence with a product lifetime model. Another negative for product launch models is that you cannot account for dynamic prevalence with a product launch model.
Also in a future newsletter, we can talk about the implications a product lifetime approach might have on calculating value-based prices from a cost-effectiveness analysis. This newsletter is focused on the impact a product lifetime approach has on a cost-effectiveness estimate (i.e., an incremental cost-effectiveness ratio).
SO WHAT
Using our generalized cost-effectiveness analysis of Attruby™ for Transthyretin Amyloid Cardiomyopathy, I present the difference between the product launch model with a single cohort that uses time-varying drug prices and the product lifetime model with multiple cohorts that use time-varying drug prices.
In the first bar in the chart below, we use conventional cost-effectiveness analysis methods that model a single cohort starting the drug at launch and keeping the drug prices at launch constant over the patient’s lifetime time horizon. This cost-effectiveness estimate can be interpreted as the cost-effectiveness for a patient starting the treatment at launch in a world where the launch price stays constant forever. (Note: No drugs were used in the comparator arm of the model and thus no price dynamics were needed for the comparator in this scenario.) This bar represents the conventional approach.
The second bar plots the cost-effectiveness using a product launch model that includes time-varying costs in a single cohort that starts the intervention of interest at launch. We assumed generic competition would enter after year 12, there would be no change in the drug’s price over the exclusivity period (beyond inflation), and the drug’s price would drop to two times its cost of goods sold after its loss of exclusivity. This cost-effectiveness estimate can be interpreted as the cost-effectiveness for a patient starting the treatment at launch. From this approach, we do not have all of the information to make assessments of the intervention’s overall cost-effectiveness, but rather we only have information on the intervention’s cost-effectiveness for patients starting the drug at launch. This analysis would need to be updated for people who start the treatment after the launch year as their time to loss of exclusivity is different and thus their cost-effectiveness is different.
The third bar plots the cost-effectiveness using a product lifetime model with multiple cohorts—with each new cohort starting treatment each year the product is in the market, and each cohort incorporating price dynamics. This cost-effectiveness estimate can be interpreted as the cost-effectiveness of the treatment over its time in the market—which I would argue is the conclusion we are trying to make when we are assessing the cost-effectiveness of a treatment.
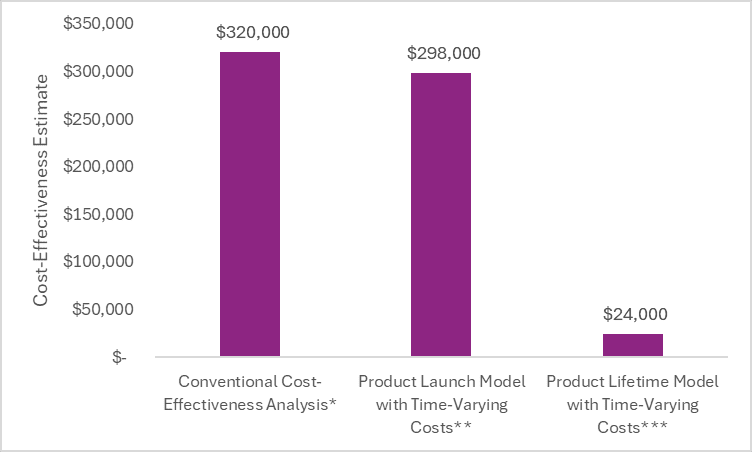
**Single cohort, dynamic drug pricing
***Multiple cohorts, dynamic drug pricing
Looking at the figure above, you will notice that the cost-effectiveness estimate from the conventional cost-effectiveness analysis (that assumed static drug pricing) and the cost-effectiveness estimate from the product launch model (that assumed time-varying drug pricing) are quite similar. This is because in the cohort of patients that start treatment at launch, less than 8% are still alive and on treatment at the time of loss of exclusivity. Therefore, the price after loss of exclusivity doesn’t dramatically impact the cost-effectiveness estimate for those who start the treatment at launch because most people who started treatment at launch have died or discontinued treatment by the time of loss of exclusivity in this example.
However, as patients start treatment closer to the time of loss of exclusivity, the impact of including price dynamics intensifies. This is illustrated in the figure below.
Additionally, for models with longer survival or treatments with less discontinuation or treatment switching, the impact would be larger. Therefore, the impact of incorporating price dynamics on the cohort that starts the treatment at launch varies by population (e.g., age, mortality) and treatment (e.g., discontinuation) characteristics.
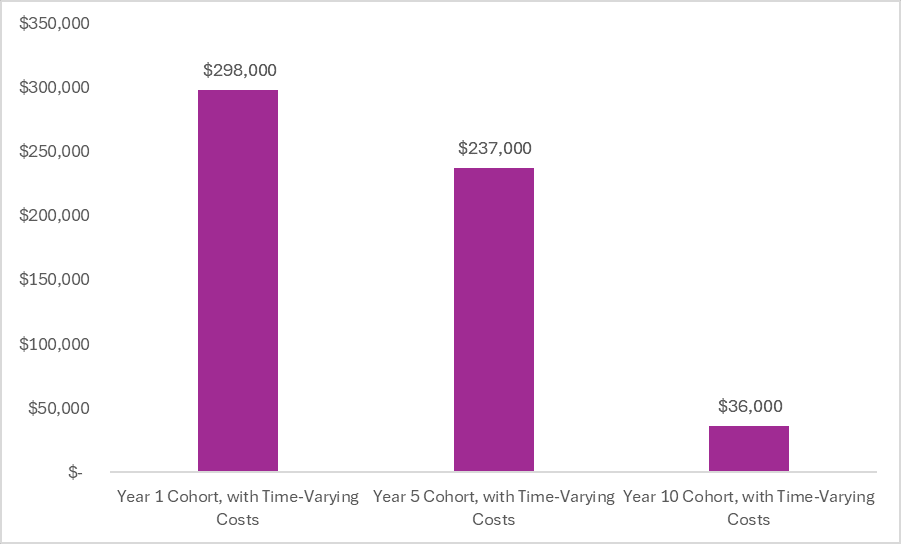
For the cohort of patients that start treatment five years after launch (represented by the middle bar in the figure above), 28% are still alive and on treatment at the time of loss of exclusivity. Thus the inclusion of time-varying costs has a greater impact. For the cohort of patients that start treatment 10 years after launch (represented by the third bar in the figure above), 65% of the starting cohort is alive and on treatment at the loss of exclusivity and thus the inclusion of time-varying costs has a huge impact.
The cost of a treatment varies over time. These expected changes should be accounted for using time-varying costs (i.e., dynamic costs) in cost-effectiveness analyses for all drugs in the model (intervention and comparator as relevant). Additionally, the cost-effectiveness of a treatment varies over time. These expected changes should be accounted for using stacked cohorts to bring the interpretation of cost-effectiveness findings closer to the question being asked.
So what? Does this really matter? I would argue yes. Although no single threshold is used in the US for healthcare decision-making, the conventional cost-effectiveness estimate that assumed static pricing and the product launch model with dynamic costs exceed commonly used thresholds of $100,000 to $150,000 per health outcome gained. However, when you look at the product lifetime model, the cost-effectiveness estimate is beneath these commonly used thresholds.
By neglecting to account for changes in a drug’s price and across the product’s lifetime, the cost-effectiveness analysis may incorrectly suggest that the intervention represents unfavorable value. However, as demonstrated in the scenario above, looking at the product across its lifetime may suggest it is quite favorable.
Disclosures
The Center for Pharmacoeconomics (“CPE”) is a division of MEDACorp LLC (“MEDACorp”). CPE is committed to advancing the understanding and evaluating the economic and societal benefits of healthcare treatments in the United States. Through its thought leadership, evaluations, and advisory services, CPE supports decisions intended to improve societal outcomes. MEDACorp, an affiliate of Leerink Partners LLC (“Leerink Partners”), maintains a global network of independent healthcare professionals providing industry and market insights to Leerink Partners and its clients. The information provided by the Center for Pharmacoeconomics is intended for the sole use of the recipient, is for informational purposes only, and does not constitute investment or other advice or a recommendation or offer to buy or sell any security, product, or service. The information has been obtained from sources that we believe reliable, but we do not represent that it is accurate or complete and it should not be relied upon as such. All information is subject to change without notice, and any opinions and information contained herein are as of the date of this material, and MEDACorp does not undertake any obligation to update them. This document may not be reproduced, edited, or circulated without the express written consent of MEDACorp.
© 2026 MEDACorp LLC. All Rights Reserved.