Health policy and investing are at an intersection
There is a lot going on in the industry right now, and we all have a lot to read to keep up. To streamline your reading, I called out the stakeholder group each section is most relevant for.
FOR POLICY MAKERS
Engage investors when developing health policies to more accurately quantify the consequences of the policy.
A peer-reviewed manuscript by Richard Xie and colleagues was published last week that showed how healthcare policies like the Inflation Reduction Act influence decisions of healthcare investors.
The authors developed a Net Present Value (NPV) model for a hypothetical small molecule subject to Medicare Drug Price Negotiation and presented the NPV and investment decision at the various investment stages (e.g., seeding, pre-clinical, phase I, phase II, phase III, file, market).
They presented numerous illustrative scenarios in the manuscript to quantify how Medicare drug price negotiation might impact the NPV and decision to invest at different stages. Using their base-case assumptions, the Medicare drug price negotiation program reduced the NPV for the hypothetical small molecule by 40% at the time of launch. The impact was even greater at earlier decision points. The NPV was negative (i.e., the hypothetical product would not be advanced) in preclinical and seeding using their base-case assumptions.
The purpose of the manuscript was not to suggest the specific impact the Medicare drug price negotiation program will have on investment decisions, but rather to illustrate the key drivers of investor valuation and the influence that a health policy can have on investment decision making—and how that impact differs at different investment stages.
Healthcare policies and healthcare investment are intersected. Society wants policies that promote efficient healthcare. Society also wants new healthcare treatments.
The authors argue that when policy evaluators are building policy simulation models to estimate the impact of policy proposals, investor behavior at all stages of development should be considered. Like all models, these policy simulation models require assumptions. Investors should be engaged to ensure the assumptions are real-world and evidence based.
FOR INVESTORS AND INNOVATORS
Prioritize evidence for market access in addition to evidence for regulatory approval.
A paper by Sreeram Ramagopalan and colleagues encourages investors and drug developers to consider health policy and market access in their decision making. The authors describe how the drug-pricing related provisions within the Inflation Reduction Act demonstrate the changing market access landscape in the US.
The authors explain how the primary historical focus for the valuation of a product has been on regulatory approval. That makes sense—sales/revenue can follow after regulatory approval. But as the authors explain, sales and market access are not always a guarantee after regulatory approval.
Suboptimal market access results in suboptimal sales.
The authors suggest that good market access can be “achieved through strong evidence of clinical benefit and value to healthcare systems”. Investors and innovators focus extensively on evidence around clinical benefit, which is necessary for regulatory approval, but there are additional evidentiary requirements for market access that may not be prioritized.
The authors describe how market access expertise can be used by investors and innovators to inform forecasts, prioritize pipeline opportunities, and launch products. “Effective market access strategies can enhance commercial success through better pricing, broader reimbursement, and/or faster uptake.”
Healthcare policies and healthcare investment are intersected. Society wants ongoing healthcare innovation. Society also wants policies that promote efficient healthcare.
The authors argue that when investors and innovators are forecasting revenue and building NPV models, market access should be considered in addition to regulatory approval. Like all models, assumptions will be required, and experts in market access can be engaged early to inform these assumptions.
FOR HEALTH ECONOMISTS
Report estimates of the percent on treatment over each year of an economic model’s time horizon if using static treatment costs and a single cohort.
Summaries of health economic models should consistently report 1) the aggregate non-treatment costs and 2) the percent of the cohort on treatment over each year of the model. Reporting these could allow users of the information to consider lifecycle pricing even if the economic model did not incorporate dynamic pricing and/or stacked cohorts. There is uncertainty and dynamicity in treatment costs, so presenting these two pieces of information would better allow the user of the information to make their own treatment cost assumptions and subsequent judgments.
In our CPE Exclusives, we have shown how influential the incorporation of dynamic pricing (i.e., price changes during and after the exclusivity period) can be on interpreting the cost-effectiveness of a drug. However, incorporating dynamic pricing within cost-effectiveness analysis is not common.
If health economists started reporting aggregate non-treatment costs separate from total costs and started reporting the percent on treatment over time, then consumers of the economic model could better consider pricing and manufacturer “reward” across the product’s lifecycle even if the model didn’t account for dynamic pricing or stacked cohorts.
If the non-treatment costs were reported separately, one could easily calculate the per-patient lifetime monetary benefit of the intervention ignoring the cost of the intervention. You would simply take the incremental health outcomes (e.g., 1 equal value life year) multiplied by a threshold (e.g., $150,000 per equal value life year) and subtract the added non-treatment costs (e.g., $10,000 of cost savings). Using the illustrative numbers provided in the parentheses, the per-patient lifetime monetary benefit would be $160,000 = (1*$150,000) – (-$10,000).
So for this illustrative example, $160,000 is the economic value of the drug created per person (and not including the cost of the drug which may be unknown and will vary over time). Importantly, this estimate is over the entire time horizon—this isn’t an annual estimate. Even more importantly, there is wide uncertainty attached to any estimate from a model and a single point estimate should not be used, but this is an illustrative example.
Now that you have calculated the per-patient economic value estimate ($160,000 in this illustrative example), you can compare that to the cost of the drug over the time horizon. If you know the percent on treatment over the model time horizon, you can consider lifecycle pricing and estimate dynamic incremental treatment costs even if the original model did not.
For example, the table below reports the percent on treatment for each year over the model time horizon in column B. If that information was reported, one can estimate the treatment cost over the time horizon using static or dynamic assumptions. We do this in columns C and D assuming a price over the exclusivity period of $20,000 per year, a 14 year exclusivity period, and a price after the exclusivity period of $500 per year. One could also calculate the treatment cost for cohorts that start at different time points as we do in columns E and F. These estimates of treatment cost could then be compared to estimates of the per-patient economic value.
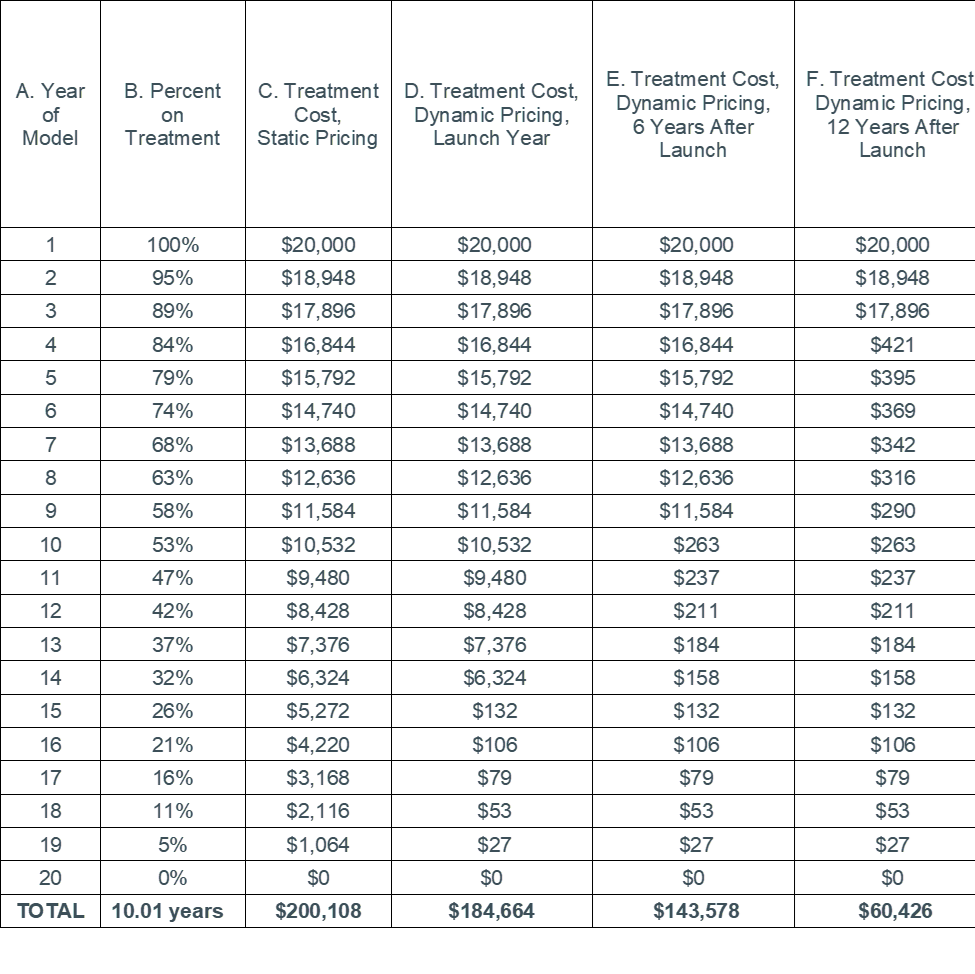
Notes: A real example can easily account for discounting. Estimates of percent on treatment should be reported for each treatment in the model that is expected to have time-varying costs.
Economic models can be powerful tools for decision making. Reporting 1) the aggregate non-treatment costs and 2) the percent on treatment over each year of the model can provide information so that consumers of the findings can consider lifecycle pricing even if the economic model did not incorporate dynamic pricing and/or stacked cohorts.
Reporting these two elements should not require additional data or programming as it is already common practice to track the percentage on treatment over the model to assign treatment costs and it is already common practice to calculate treatment costs separate from other cost inputs.
Disclosures
The Center for Pharmacoeconomics (“CPE”) is a division of MEDACorp LLC (“MEDACorp”). CPE is committed to advancing the understanding and evaluating the economic and societal benefits of healthcare treatments in the United States. Through its thought leadership, evaluations, and advisory services, CPE supports decisions intended to improve societal outcomes. MEDACorp, an affiliate of Leerink Partners LLC (“Leerink Partners”), maintains a global network of independent healthcare professionals providing industry and market insights to Leerink Partners and its clients. The information provided by the Center for Pharmacoeconomics is intended for the sole use of the recipient, is for informational purposes only, and does not constitute investment or other advice or a recommendation or offer to buy or sell any security, product, or service. The information has been obtained from sources that we believe reliable, but we do not represent that it is accurate or complete and it should not be relied upon as such. All information is subject to change without notice, and any opinions and information contained herein are as of the date of this material, and MEDACorp does not undertake any obligation to update them. This document may not be reproduced, edited, or circulated without the express written consent of MEDACorp.
© 2026 MEDACorp LLC. All Rights Reserved.